by Tim Ogle
If your shop requires forecasting of inventory and the placement of advance orders, it is time to review your Open To Buy methods (OTB). Open To Buy is necessary for retailers to control their inventory. High-speed cloud based technology is making open-to-buy planning accurate and profitable at levels previously unattainable. Three to eight percent gross margin improvements are common. The reasons are simple. Almost every retail performance measure depends mathematically on inventory levels: return on investment, turn ratio, stock to sales ratio, gross margins, cost of goods sold, balance and cash flow.
Plan to Optimize
Optimizing inventory levels will improve every one of these performance standards, and is perhaps the most important single factor for retailing success. Most independent retailers opt to do their own planning, using a variety of methods including calculators, sharp pencils, gut feelings, and spreadsheets. These manual methods are far more costly than professional software.

Making the Switch
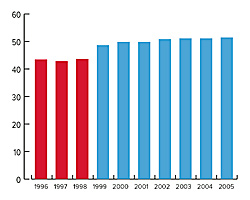
The table shows the Gross Margin Percent of a shop that switched from a good open-to-buy spreadsheet, which calculated eight major departments, to a good software program that easily calculated all 32 classifications. The three columns on the left are when they were still using spreadsheets.
This shop began using OTB software at the beginning of 1999, and at the end of that year when the numbers were crunched, saw that the gross margins had improved by five percent. In a $500,000 shop, that is $25,000 straight to the bottom line. The following years proved that this was not a one-time anomaly. There were incremental improvements for the next six years, to 8 percent above the spreadsheet baseline. That is a $40,000 recovery of untapped margins! They had risen to an entirely new plateau of performance, not just in gross margins, but also in every retail performance measure.
This shop never had too much inventory or too little inventory. They were very close to optimum in every classification for every month of every year of this time period. If any sales trends began to develop at the end of each month when raw data from the POS was entered into the OTB software, with one click of a button the entire OTB forecast was regenerated right back to optimum for every classification in every month.
Why is software more efficient & profitable than spreadsheets?
The answer, in retrospect, is quite simple. With software there are no practical limitations on how many classifications to calculate for OTB solutions, so they calculated all 32 sub classifications. It made all the difference. There was no other explanation, because there were no other changes for that 10-year period. There was the same buyer, same management, same floor space, and no spikes in weather or economy. The method of calculating the OTB was the only change.
We now know that the difference between having an OTB for only major departments, and having one for every classification, was $25,000 to 40,000. We know that the lost opportunity “cost” of the spreadsheets was $25,000 to 40,000. Additionally, in this example, the Average Inventory dropped from $101,000 to $86,000. That is $15,000 in the bank, instead of the storeroom!
If you want optimum margins and other performance measures, you must have optimum inventory, not just in major departments, but also in every classification. The only practical and affordable way to do that is with fill-in-the-blank OTB software. The math is done for you, not by you. This is the latest technology to “do-it-yourself,” and replaces the calculator or spreadsheet, which have become outdated and far too costly.
Finding the right software
Go to Google and type in, “Open To Buy Software.” Find the three or four that look the most promising to you. Examine the products and make an informed choice. The risk/reward ratio is off the charts for this decision. $25,000 to 40,000/year balanced against provider’s fees, which are insignificant in comparison. Of course, not every shop will produce an additional $25,000 to 40,000, but some will. Some will produce less and some larger shops will produce more. One thing you can be certain of: if you have been calculating only partial classifications for OTB, and you upgrade to a system that can calculate every classification, whatever retail performance plateau you have been on will rise to an entirely new plateau.
Tim Ogle is Founder and President of Open To Buy Wizard, LLC, in business since 1999. He has contributed several published articles to national magazines, on discounting, markdowns, pricing, and open to buy planning.
